
This post may contain affiliate links. Please see my disclosure policy for more details.
If you’re wondering how much Australian house prices are in 2025, this blog post will run through the median house price and unit/flat price in Australia’s major cities.
Before buying a house in Australia, it’s crucial to research the Australian property market to learn about real estate trends and average prices in the different regions, as they vary widely. The median house price in Sydney is currently 2.4-times higher than the median house price in Darwin, for example. Read on to find out more about the Australian housing market in 2025.
Australian Property Prices: Table of Contents
- Median house prices
- Median unit/flat prices
- Annual real estate trend in Australia
- Quarterly real estate trend in Australia
- Interest rates in Australia
Australian Median House Prices April 2025
To give you an idea of Australia’s varying property markets, here are the current median house prices in Australia for each capital city using the CoreLogic monthly property report from April 2025.
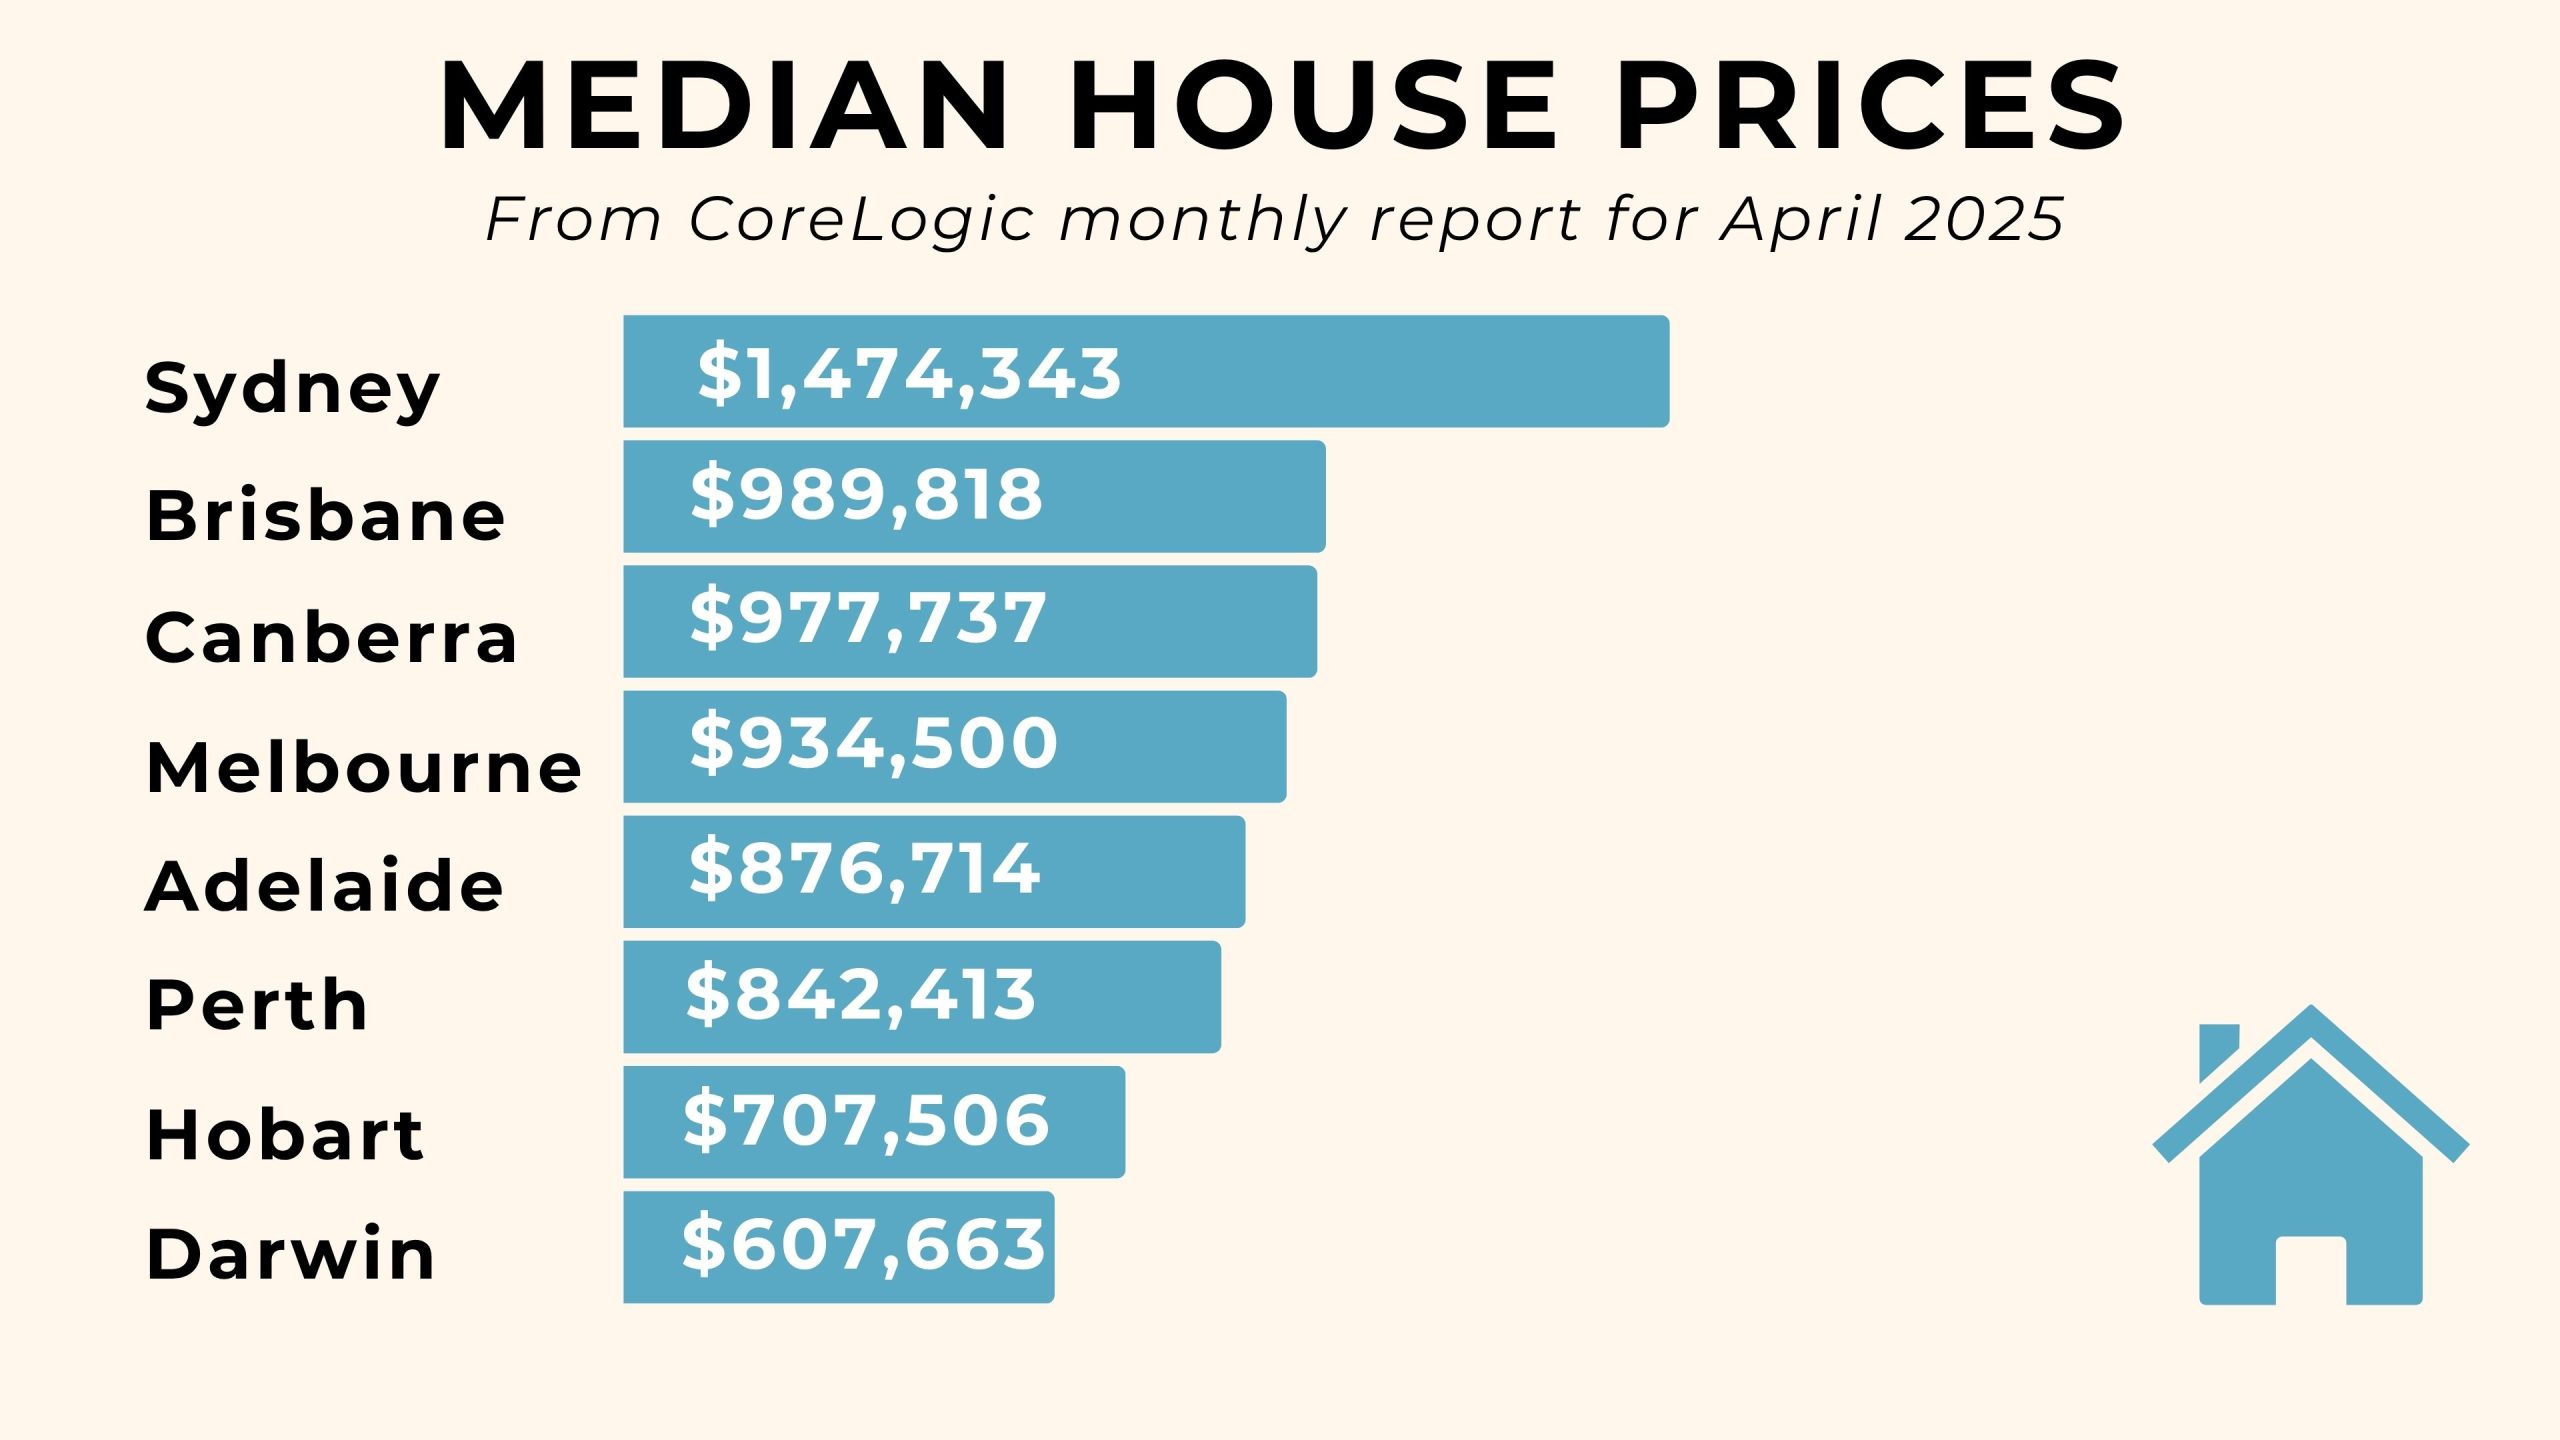
- The Sydney median house price in April 2025 was $1,474,343, making Sydney the most expensive Australian capital city to buy a house in.
- Brisbane house prices are the second-most expensive, with a median value of $989,818.
- Canberra house prices are the third highest in the country, with a median value of $977,737.
- Melbourne has the fourth-highest property values for houses, with a median price of $934,500.
- The fifth-most expensive city to buy a house in is Adelaide, with a median price of $876,714.
- Perth is the third-cheapest capital city in Australia for houses, with a median price of $842,413.
- With a median house price of $707,506, Hobart has the second-cheapest houses in the country.
- The capital city with the cheapest real estate in Australia is currently Darwin, with a median house price of only $607,663.
Australian Median Unit/Apartment Prices April 2025
If you’re interested in buying an apartment in Australia, here are the median prices for units (flats) from the same April 2025 CoreLogic report.
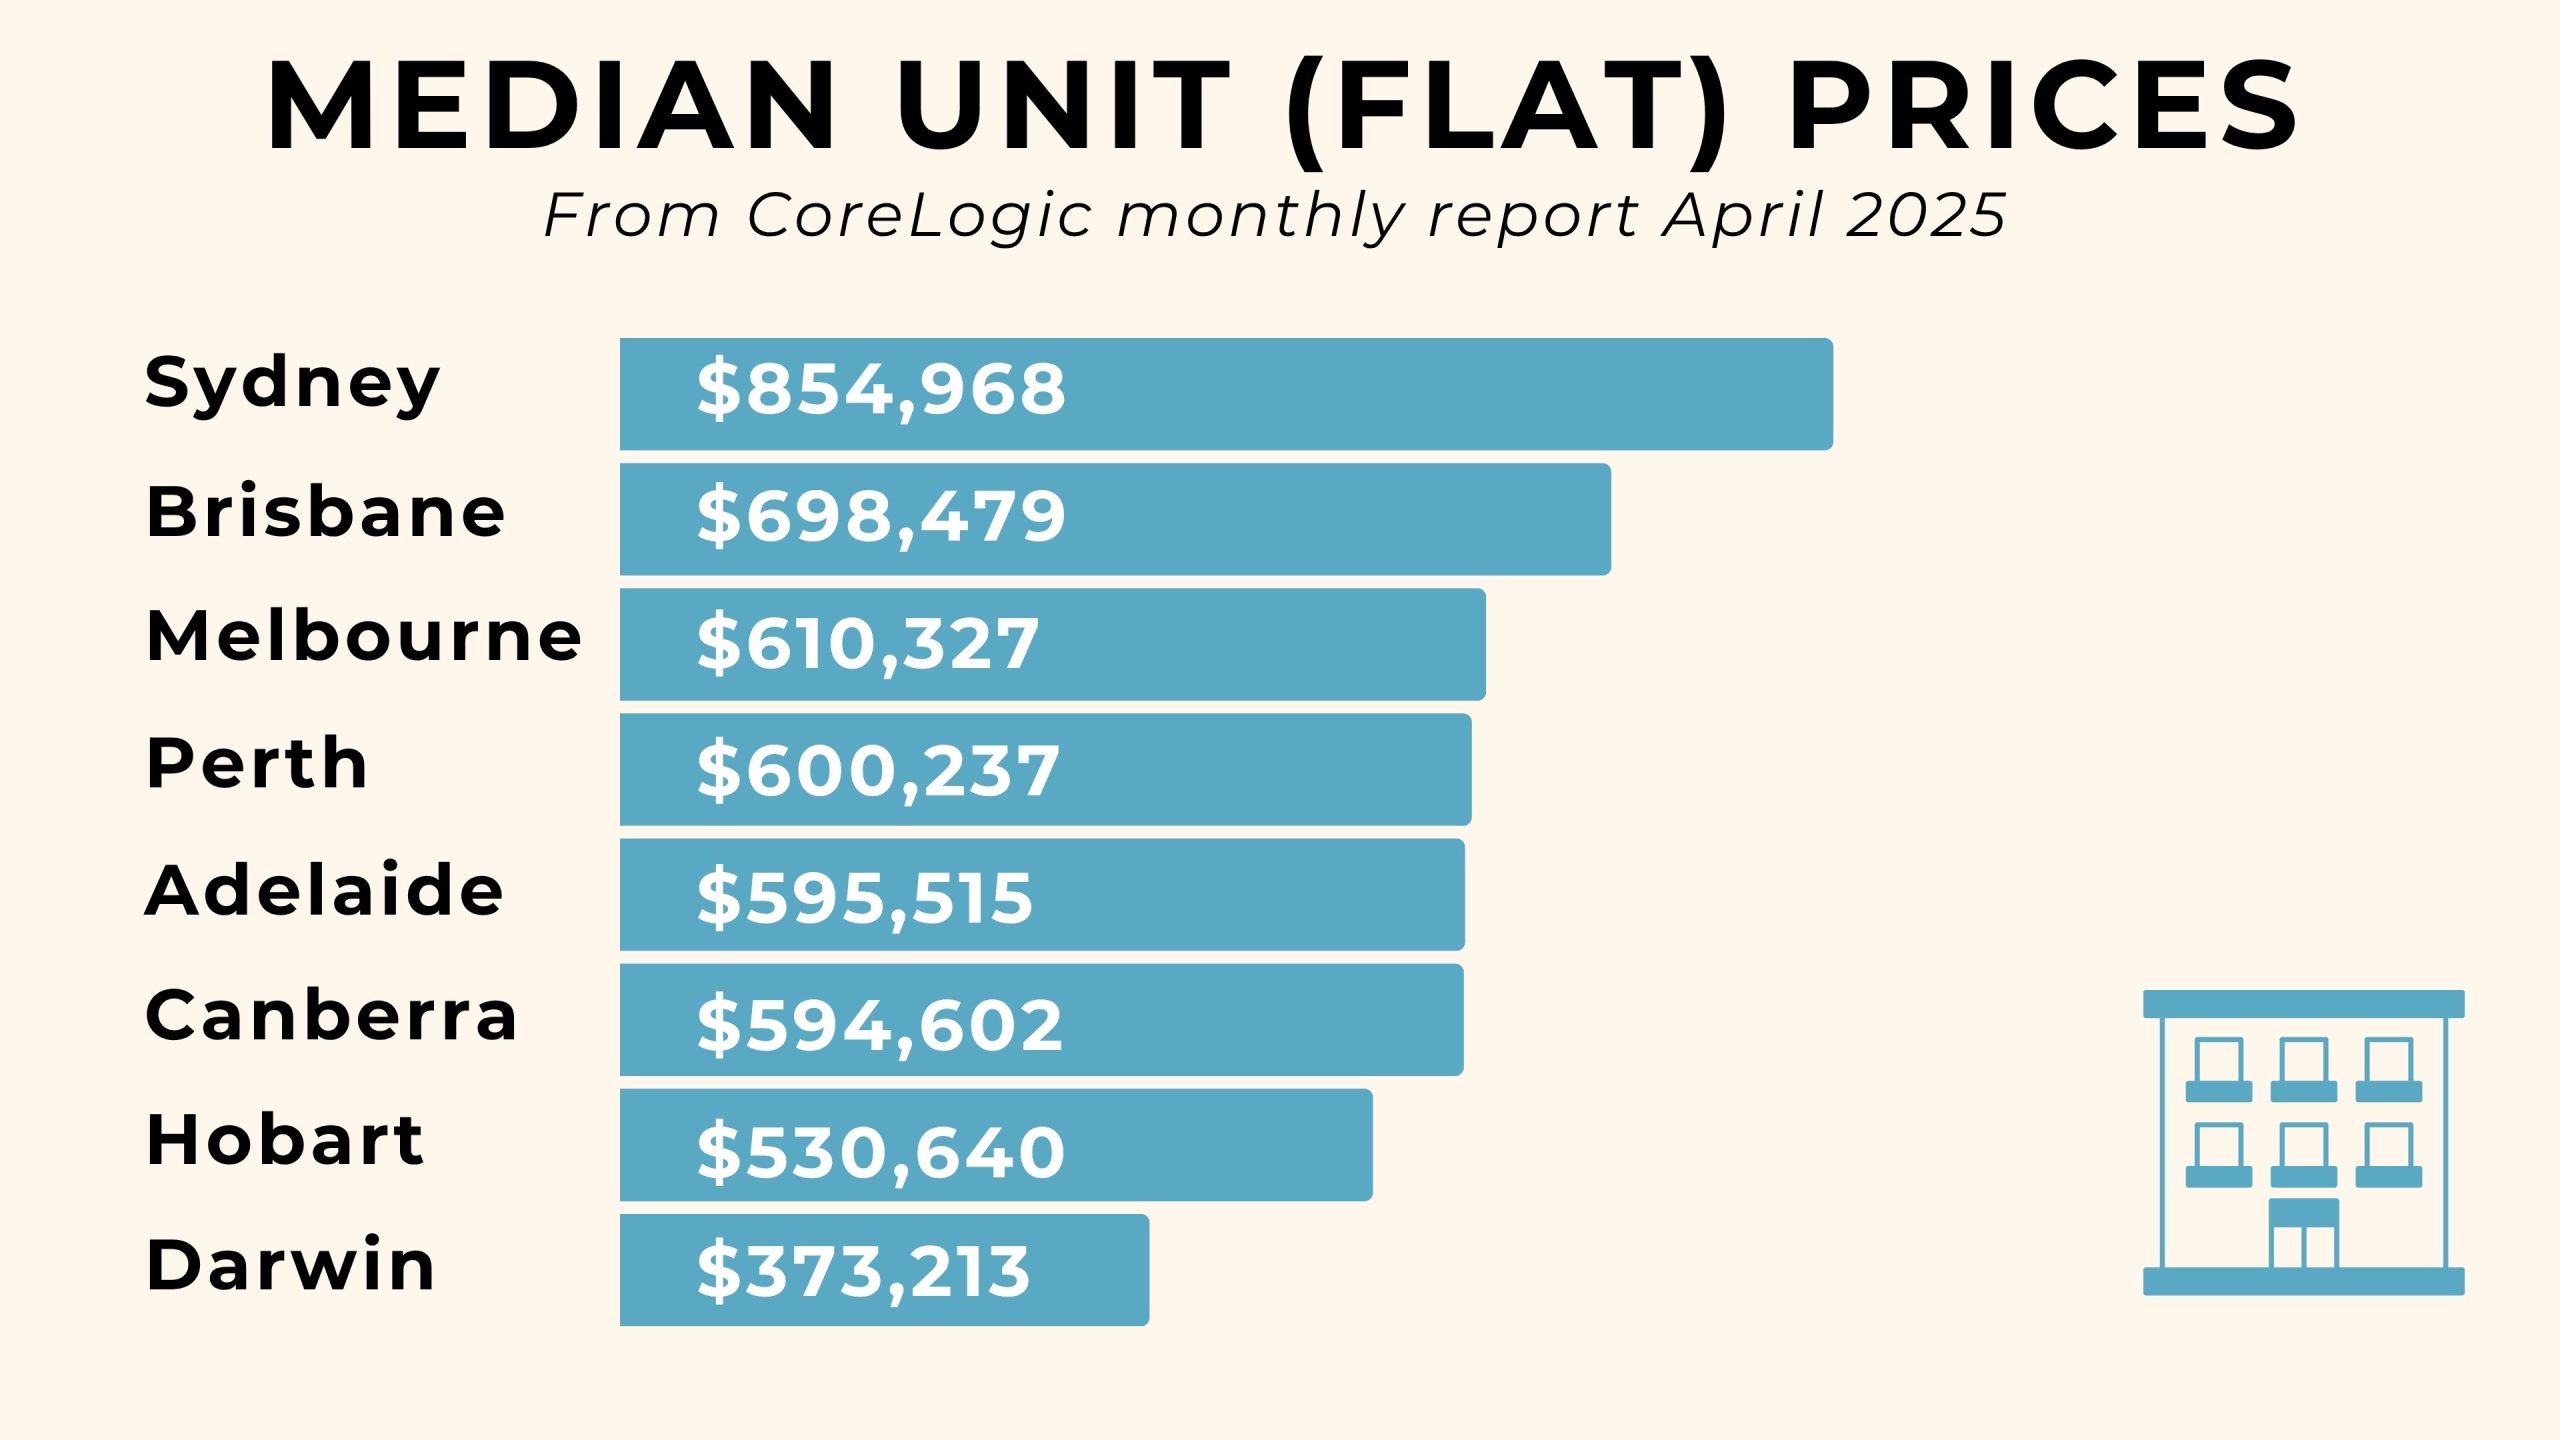
- Sydney is the most expensive capital city in Australia for units, with a median value of $854,968.
- The second-most expensive city is Brisbane, with a median apartment price of $698,479.
- Melbourne unit prices are the third highest of the capital cities in Australia, with a median value of $610,327.
- Perth has the fourth-highest unit prices, with a median value of $600,327.
- The fifth-most expensive city for flats is Adelaide, with median price of $595,515.
- Canberra apartments have the sixth-lowest median value in Australia, at $594,602.
- With a median price of $530,640, Hobart has the second-cheapest unit prices in Australia.
- The city with the cheapest real estate in Australia for apartments, is Darwin, with a median unit price of only $373,213.
Australian House Prices Annual Change in Value 2025
Next, I’ll run through the changes in property prices for each Australian state capital city during the 12 months to the end of April 2025. This should give you an idea of real estate trends in the last year.
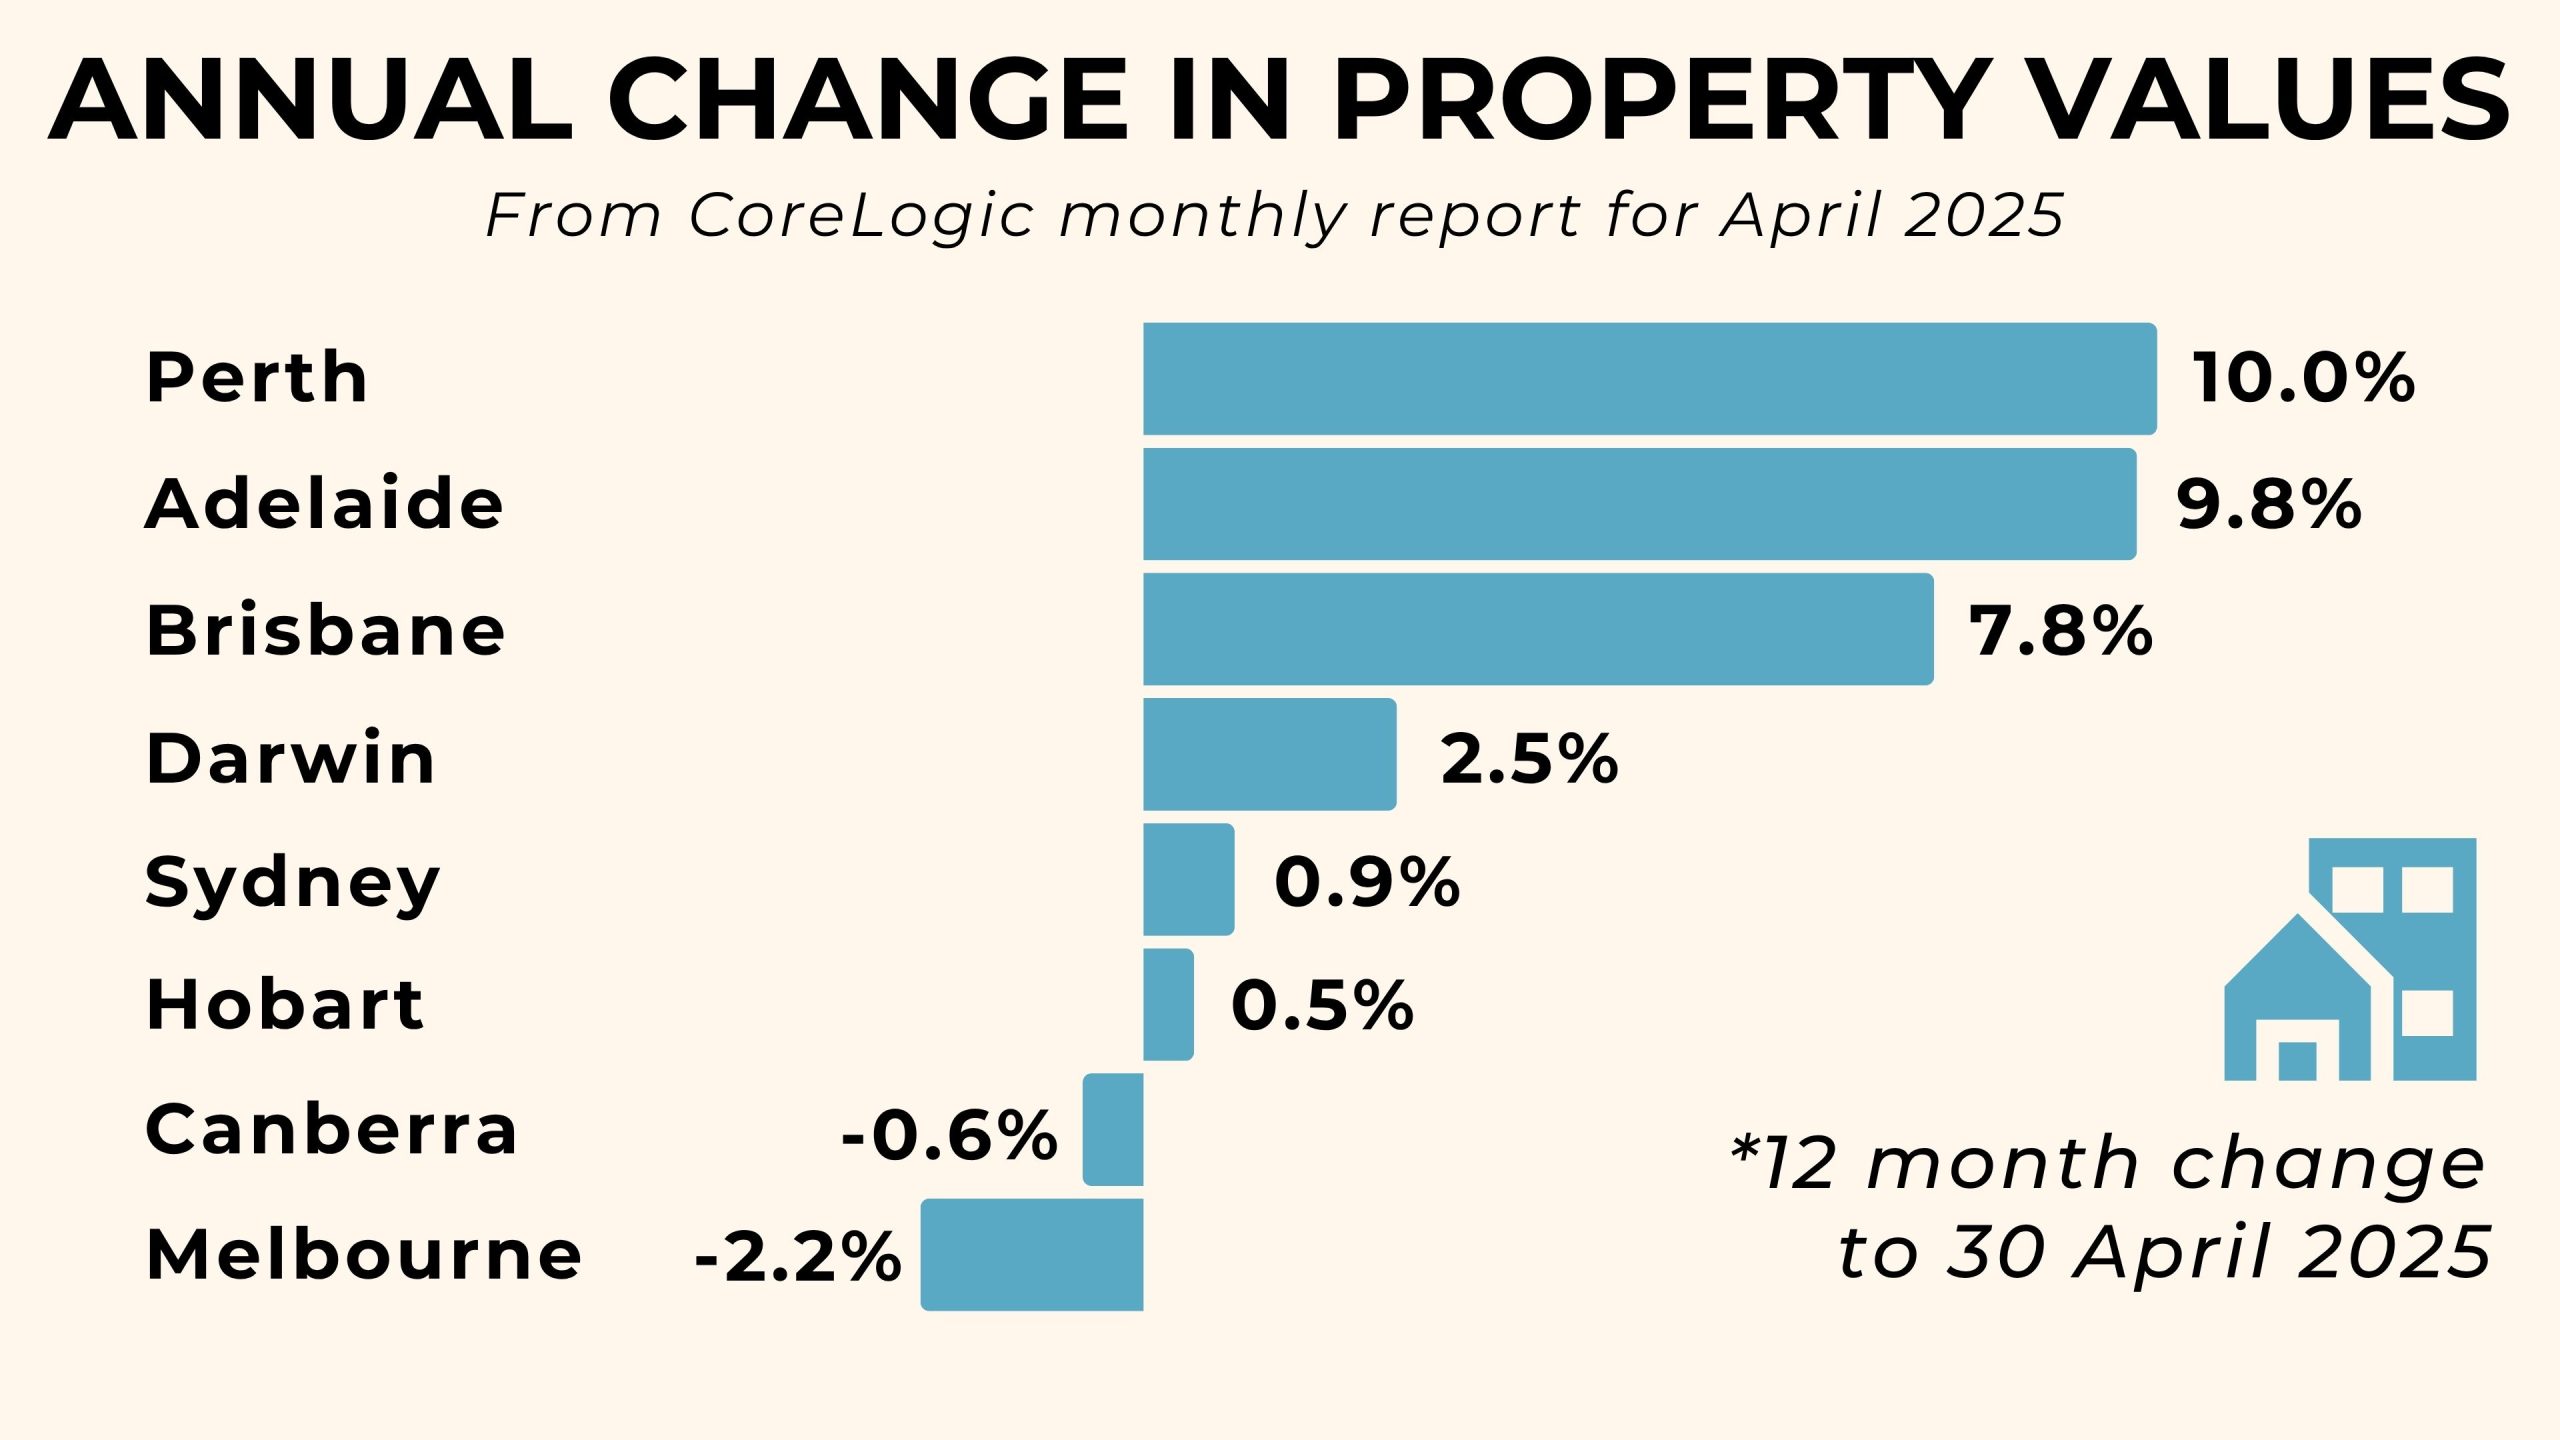
- The Australian city with the highest growth in house prices during the year to 30th April 2025 was Perth, with an average increase of 10.0%.
- Adelaide had the second-highest gains, with average property market growth of 9.8%.
- Third is the Brisbane property market, with an average rise of 7.8%.
- Darwin came fourth, with an increase of 2.5% in property values.
- In fifth place is Sydney, with an annual real estate increase of 0.9%.
- Hobart house prices came sixth, with a rise in property prices of 0.5%.
- Canberra had the second-largest fall in its property market, with a drop of 0.6%.
- The city with the highest annual decline in property values was Melbourne, with a decrease of 2.2%.
Average Quarterly Property Growth Rates in Australian Cities to 30 April 2025
To give you a more recent idea of where property values are heading in each city during 2025, here is the quarterly real estate growth from 1 February 2025 to 30 April 2025.
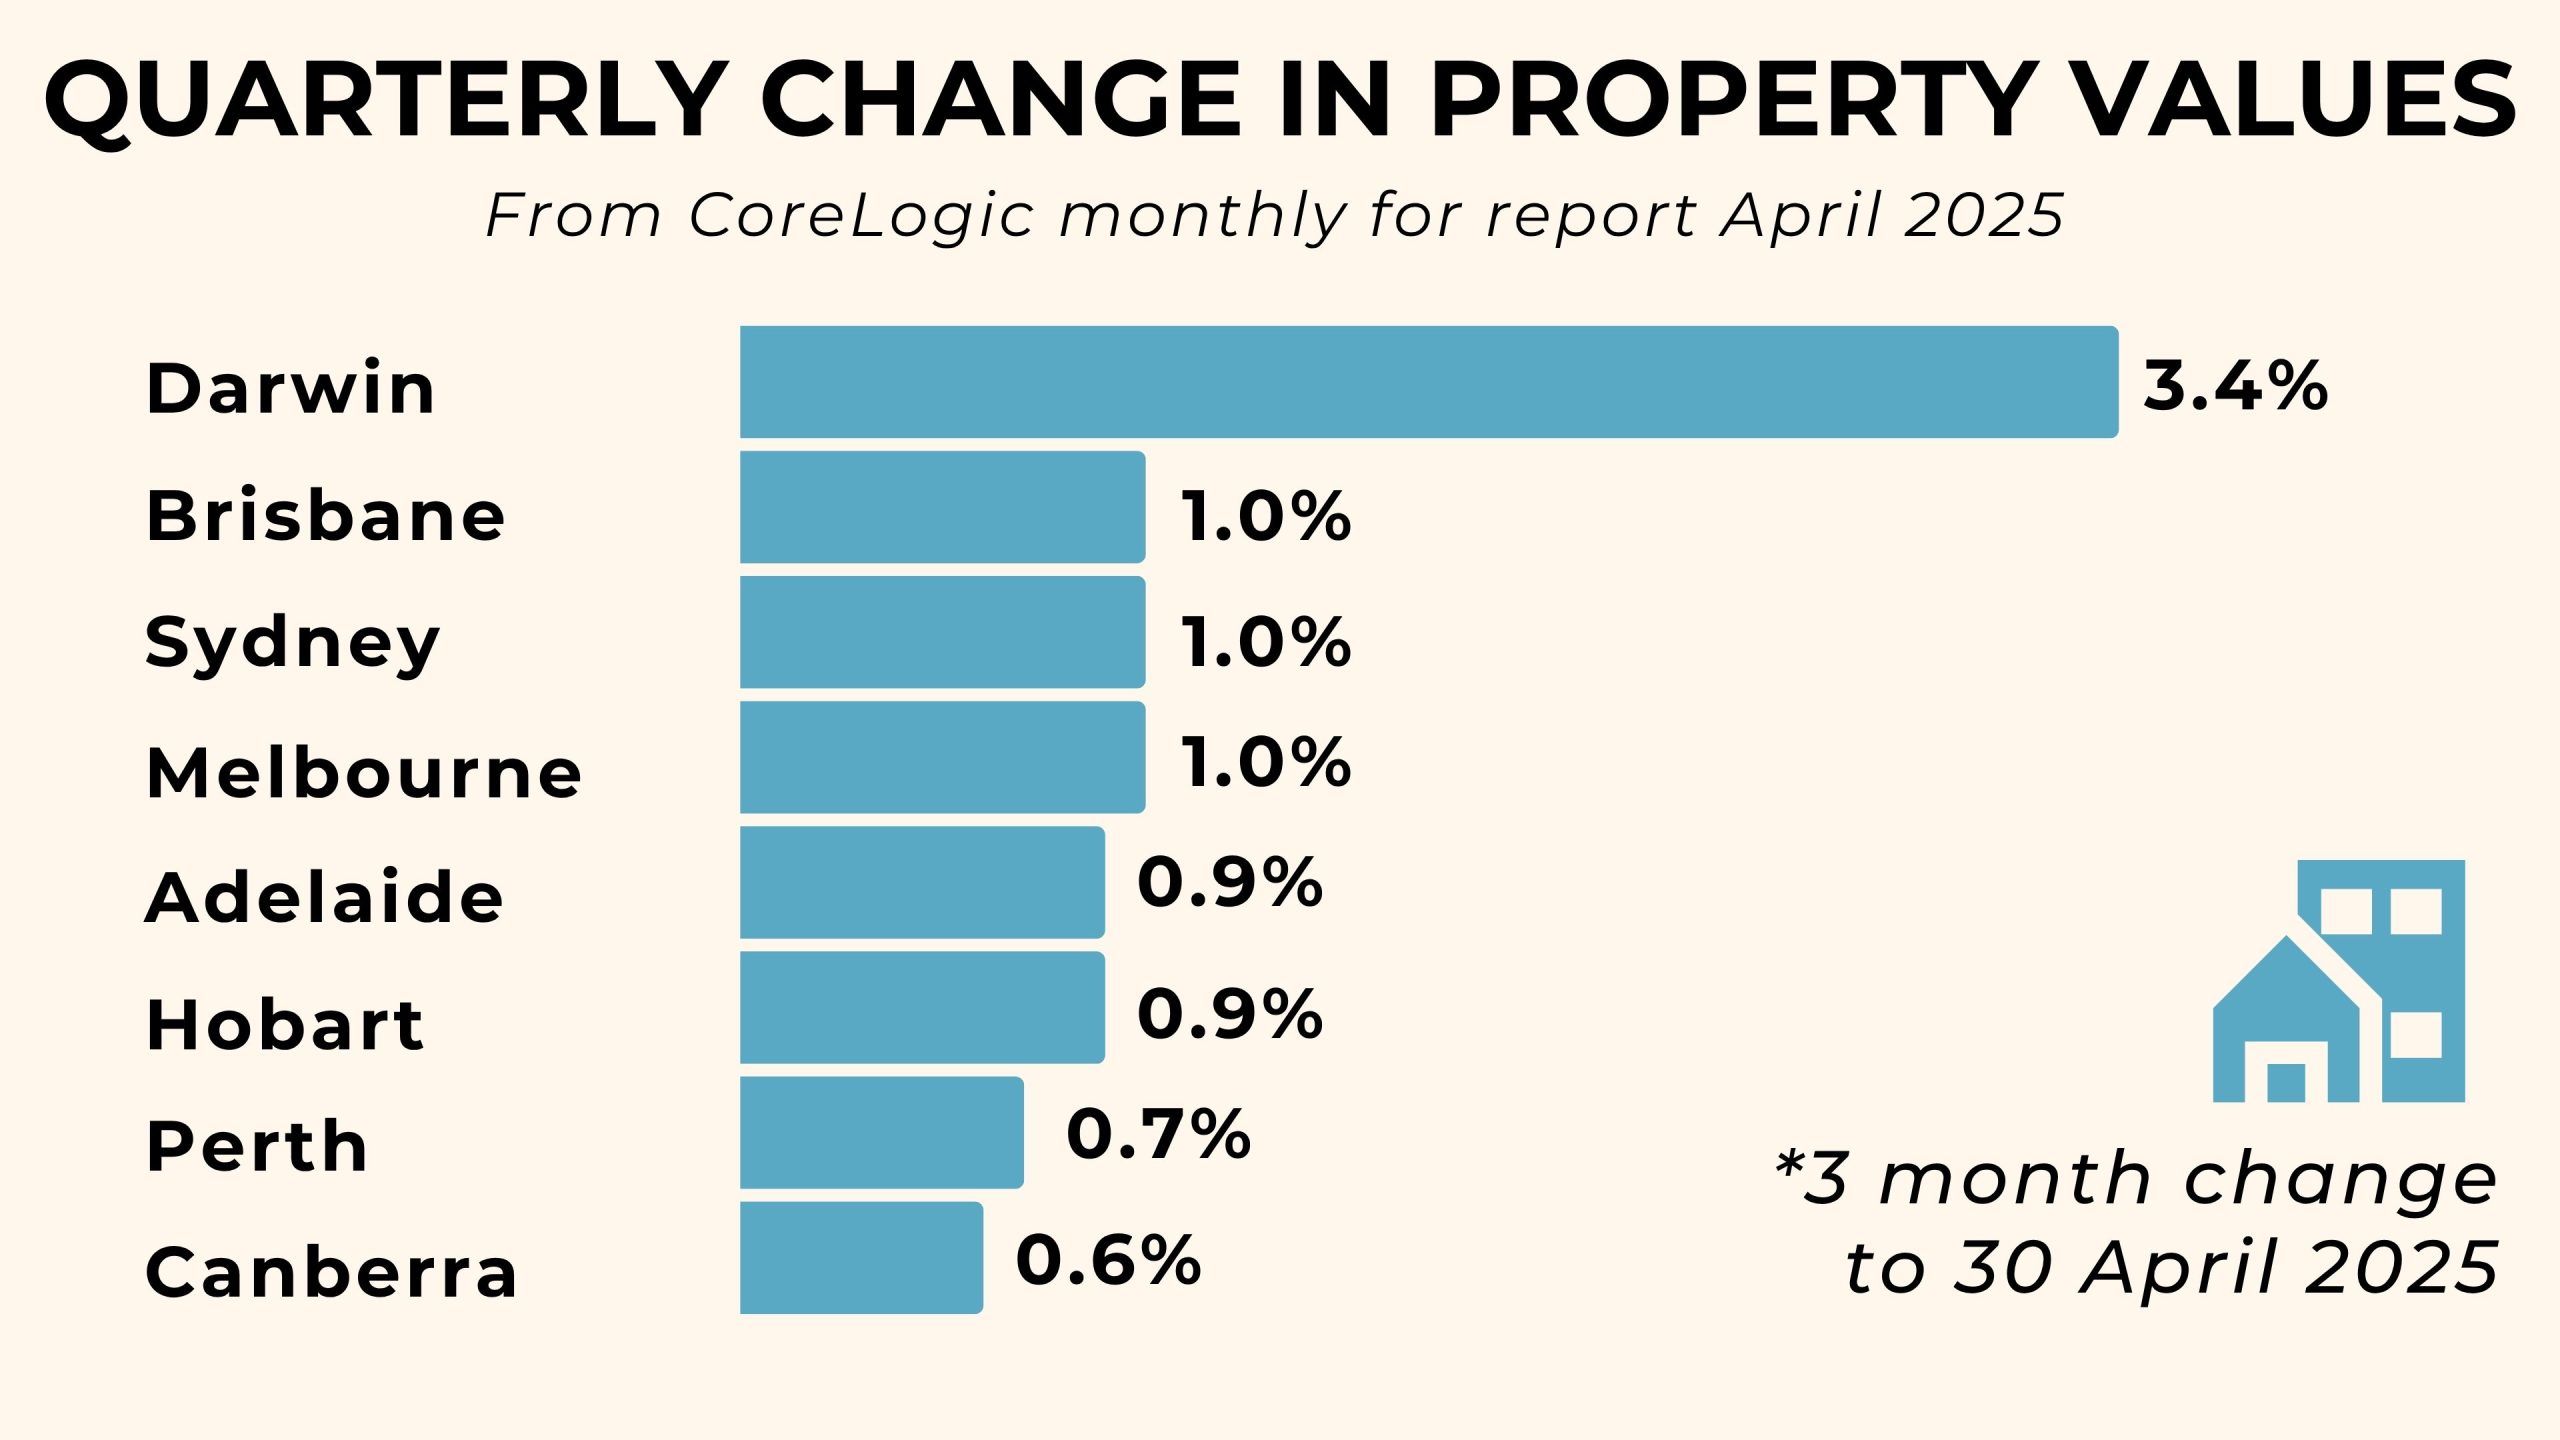
- The Australian city with the highest quarterly growth in house prices to 30 April 2025 was Darwin, with an average increase of 3.4%.
- The Brisbane, Sydney and Melbourne property markets had the joint second-highest growth in the quarter, with an average gain each of 1.0%.
- The joint third-highest gains were in the Hobart and Adelaide property markets, which both saw an increase of 0.9%.
- Perth had the fourth-largest gain in property values, with a 0.7% increase.
- Canberra had the lowest quarterly real-estate growth of 0.6%.
I hope that was useful for those of you thinking of moving to Australia or simply buying a house in Australia for the first time. If you’ll be renting when you first move over, read my post on rental prices in Australia next.
To learn more about Australian homes, check out my post on Australian vs UK houses!
If you want to look at property for sale in Australia, the best real estate websites in Australia are realestate.com.au and domain.com.au. They are similar to Rightmove in the UK.
Let me know in the comments if you’re thinking of buying a property in Australia, and how you’re finding the process!
Lisa Bull, founder of Dreaming of Down Under, has been living in Australia as a British expat since 2015. After travelling to every state and territory in Australia and living in Perth, Brisbane and Sydney, Lisa knows from first-hand experience the best destinations to visit in Australia and the best budget travel tips. Her guides on this blog have been read by over 700k readers and helped thousands of people achieve their dream of living in or travelling Australia.